
Evaluating local AI infrastructure through reproducible testing on actual hardware and representative workloads. We move beyond vendor specifications and public benchmark charts to determine how specific models and runtimes behave on operational platforms.
The Question
Can existing enterprise server hardware provide a practical foundation for local AI, and how much additional value does targeted GPU acceleration provide?
We already have an existing enterprise server platform: a Supermicro X11DPI-N equipped with dual Intel Xeon Silver 4110 CPUs (16 physical cores / 32 logical processors) and 256 GB of RAM. Instead of assuming that this older platform is unsuitable for modern local AI workloads — or immediately replacing it with expensive dedicated AI hardware — we are measuring what it can actually do.
Theoretical specifications and public benchmarks are useful reference points, but they cannot fully answer questions about a specific model architecture, a specific quantisation, a specific runtime, a specific hardware platform and, most importantly, a specific operational workload. Real workloads on real infrastructure need to be measured.
Test Strategy
Our evaluation follows a controlled progression to isolate the performance gain provided by each hardware stage:
The final stage provides a total of 32 GB of distributed VRAM; it is important to note that this is not a single contiguous memory pool, and the software's ability to leverage this distribution is part of the evaluation.
As the experiment progressed, the methodology itself was extended: workloads were separated into FAST (latency-critical) and DEEP (deep-analysis) classes, and the inference runtime became an explicitly measured variable. The phase sequence below remains part of the historical design record; the later sections of this article document how the experiment grew beyond it.
What We Measure
Raw tokens per second are a useful metric, but they are insufficient for determining operational suitability. Our benchmark series evaluates a combination of performance and quality:
Performance & Efficiency
- Model loading time
- Prompt processing (Time to First Token)
- Generation throughput (tokens/sec)
- Total execution time
- CPU, RAM and GPU utilisation
Quality & Usability
- Instruction following accuracy
- Decision quality in complex tasks
- Handling of conflicting information
- Compliance with explicit constraints
- Practical usability in operational workflows
We are deliberately testing different model sizes and architectures because nominal parameter count alone does not reliably predict practical inference performance on a specific platform.
In the later stages, the workload dimension was made explicit by separating the FAST and DEEP task classes, and the inference runtime was recorded as a distinct measurement variable alongside model loading, prompt processing and generation behaviour.
Representative Tasks
To move beyond synthetic throughput measurements, we use controlled tasks that mirror actual operational requirements. Current benchmark categories include:
- Knowledge explanation and synthesis
- Critical reasoning and logical derivation
- Operational decision making based on structured input
- Handling and resolving contradictory sensor information
- Resistance to unjustified changes in a previously reasonable decision
Over the course of the experiment, these categories were instantiated as concrete task sets: the FAST tasks — deterministic offline tests such as context diagnosis and constraint architecture — and the DEEP task, a long, source-grounded technical management review.
Phase 1 — CPU Baseline (September 2026)
The first stage of the benchmark was completed in September 2026. The CPU-only configuration therefore provides a documented baseline against which the subsequent stages of the experiment can be compared.
The results confirm that nominal model size alone is a poor predictor of practical inference performance on this platform. Models with broadly comparable parameter counts can differ substantially in generation throughput, prompt-processing behaviour and total execution time.
More importantly, performance alone does not determine operational suitability.
Some models that perform particularly well in raw generation speed show weaker compliance with source-grounding requirements in longer research tasks. Other models operate more slowly but follow citation and documentation requirements much more consistently.
This distinction is important for operational AI: the fastest model is not necessarily the best model for a specific task.
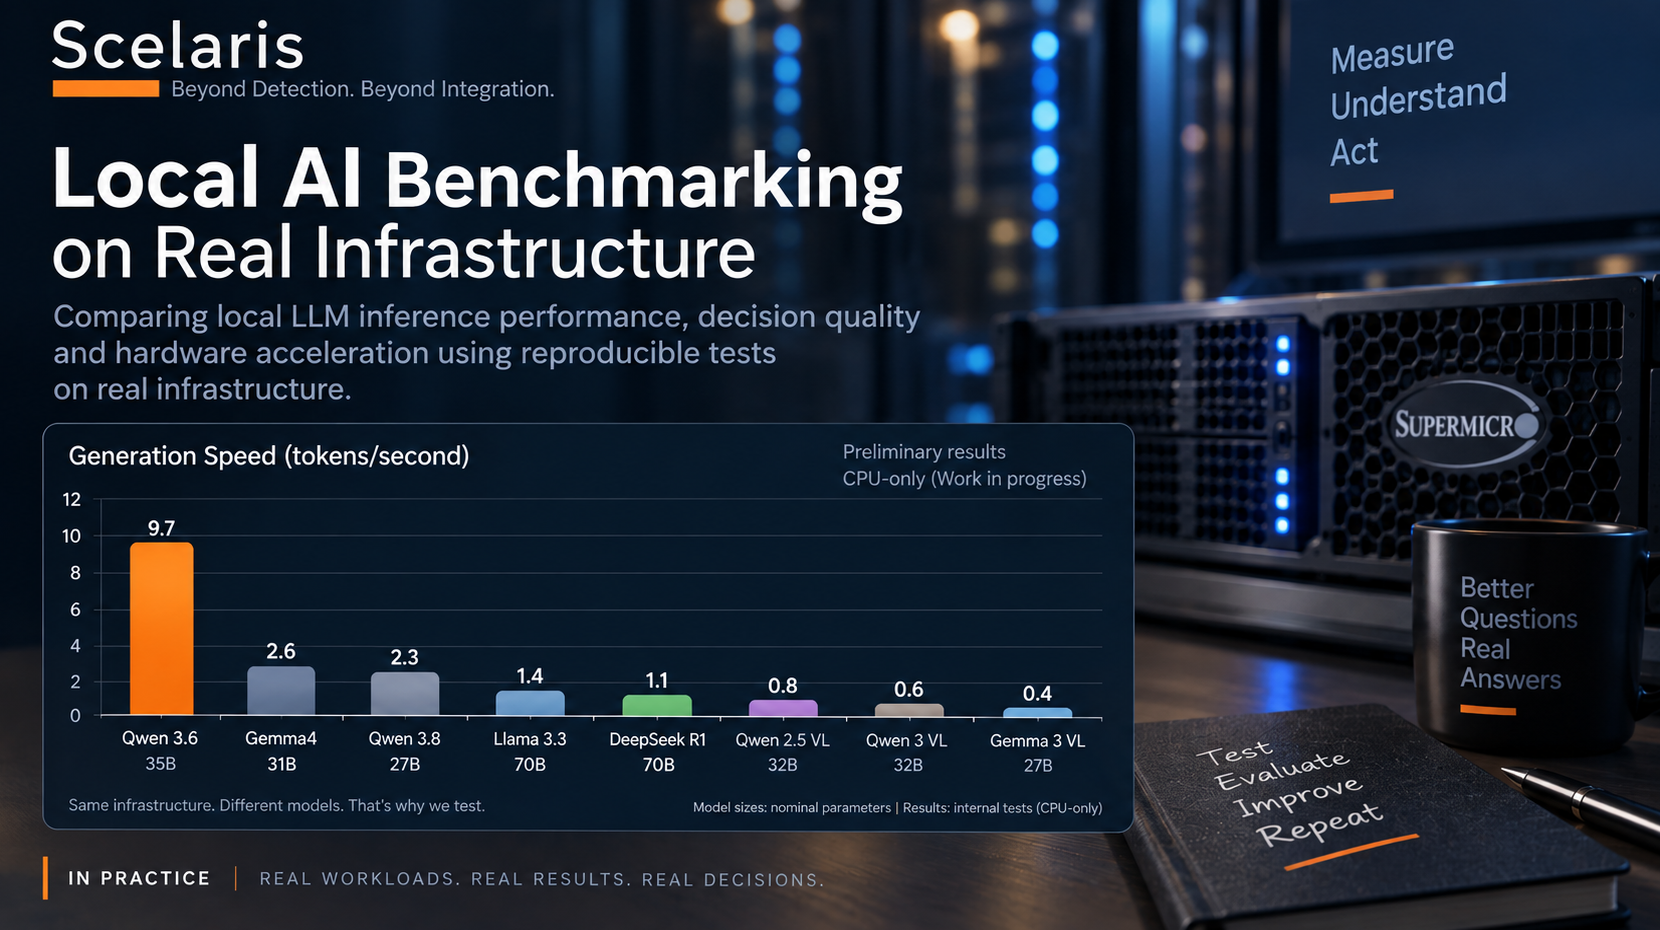
CPU Baseline measurement results on Supermicro X11DPI-N infrastructure.
The source-grounding study documented as Benchmark 3 below belongs to this CPU stage of the series.
Phase 2 — GPU Acceleration and Expanded Scope
After completing the CPU baseline, the platform was extended with GPU acceleration capability. The original benchmark design anticipated this stage: the same controlled methodology would be repeated after adding accelerators, so that measured improvement could be compared against the CPU-only record rather than extrapolated from hardware specifications.
In practice, the GPU stage did more than scale throughput. It removed capacity constraints that had limited the model space, and the experiment grew with it: larger models — including 70B-class and 235B-class models — joined the benchmark series, and the controlled task set was re-run across the expanded spectrum.
One deliberate limitation of the historical record must be stated: the archive contains results from different execution configurations, and not every result file establishes its exact GPU or offload state. This article therefore does not label individual results as "GPU-accelerated" where the evidence does not establish it, and distributed VRAM is treated as distributed: two 16 GB accelerators do not behave as one transparent 32 GB memory pool, and the software's ability to use that distribution is itself part of the engineering question.
The historically important outcome of this stage is not a single performance figure. Adding GPU capability expanded what could be measured — and at the same time demonstrated that model behaviour under real workloads still had to be measured, not assumed.
Operational implication: an accelerator does not replace evaluation; it widens the model space worth evaluating.
Replace or Extend?
This evaluation addresses a practical infrastructure decision faced by many organizations: should existing enterprise hardware be replaced, or can it be extended economically for new AI workloads?
Many organizations already operate technically sound server infrastructure that may be several generations old but still provides valuable capabilities, such as substantial installed memory capacity, ECC memory, robust server-class components, and established cooling and power infrastructure. In our case, the existing dual-Xeon platform already provides 256 GB of RAM and sufficient PCIe expansion capability to evaluate GPU acceleration.
Replacing such a platform with a completely new AI workstation is one approach; extending the existing system with suitable accelerators is another. Neither should be assumed to be the correct answer. The purpose of this benchmark is to provide measured evidence for that decision.
Existing or already depreciated infrastructure changes the economics significantly. Hardware that appears obsolete for one workload may become useful again when requirements change.
The GPU stage and the FAST/DEEP workload tracks documented below provide measured evidence for that decision on our platform. The full economic comparison — upgrade cost, operational complexity, energy efficiency, expected service life and the total cost of replacement — remains workload-specific and is not generalised here.
Benchmark 3: Source-Grounded Research and Synthesis (CPU Stage)
This benchmark belongs to the CPU baseline stage of the series; its tables and charts are preserved here in their original form.
The third benchmark extends the evaluation beyond short reasoning and decision tasks.
Each model received the same set of eight source documents describing HERMES-AI Desktop and was instructed to produce a comprehensive German-language technical overview based exclusively on those sources.
The task required approximately 1,300–1,700 words and explicitly required important factual statements to be supported by source references. Existing capabilities, planned functionality and conceptual ideas had to remain clearly separated.
This creates a useful combined test of: long-context document processing, information synthesis, instruction following, source fidelity, structured technical writing and generation performance.
The workload is deliberately representative of practical AI-assisted research and documentation rather than synthetic text generation.
Benchmark 3 — CPU-only Results
| Model | Throughput | Words | Source markers |
|---|---|---|---|
| qwen3:8b | 3.63 tok/s | 1,356 | 8 |
| qwen3:14b | 2.07 tok/s | 789 | 10 |
| gemma4:e4b | 8.15 tok/s | 1,626 | 76 |
| mistral-small3.2:24b | 2.10 tok/s | 1,163 | 30 |
| gemma4:31b | 1.29 tok/s | 1,260 | 55 |
| deepseek-r1:32b | 1.24 tok/s | 1,389 | 23 |
| qwen3.6:35b | 8.62 tok/s | 1,719 | 8 |
| qwen3.8:27b | 2.60 tok/s | 1,737 | 37 |
| llama3:70b | 0.73 tok/s | 390 | 0 |
| deepseek-r1:70b | 0.65 tok/s | 1,107 | 10 |
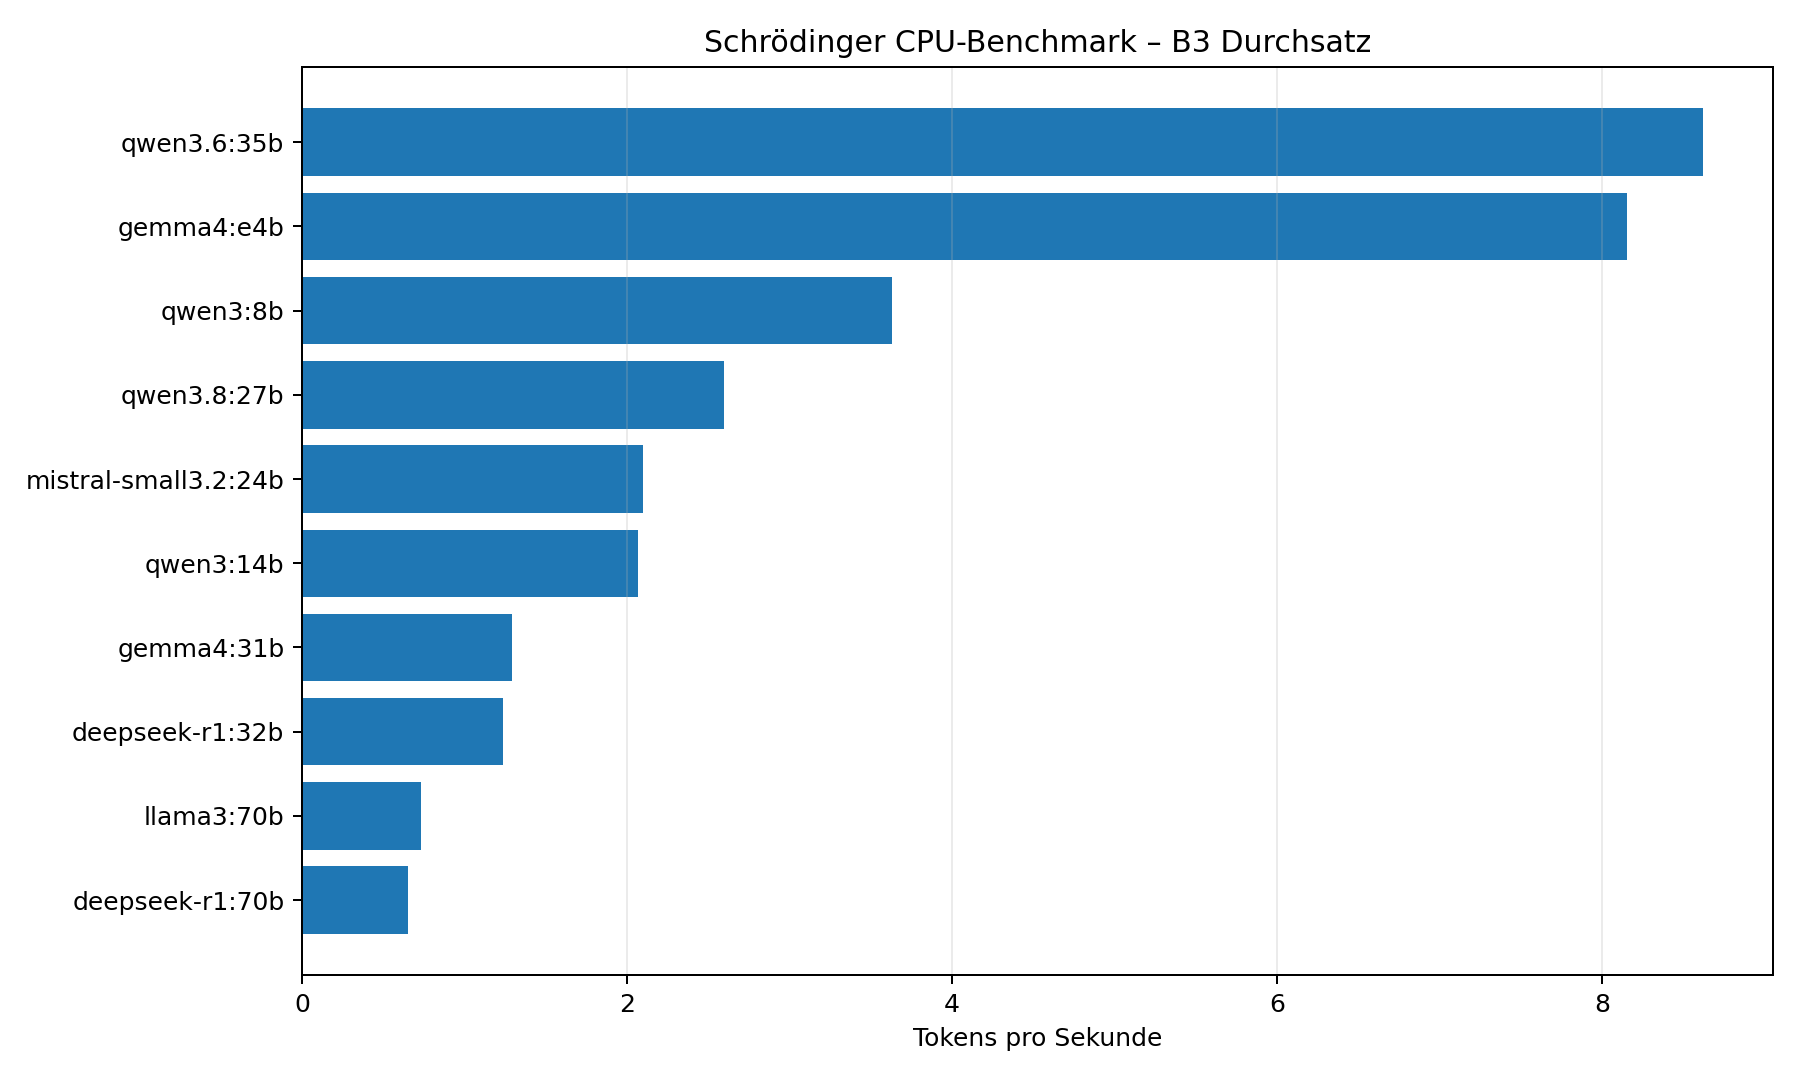
Benchmark 3 generation throughput — CPU-only baseline, Supermicro X11DPI-N, 2× Intel Xeon Silver 4110, 256 GB RAM.
Source-Grounding Behaviour
The benchmark also records the number of explicit source markers produced by each model. This metric provides an initial indication of how consistently a model follows the source-reference requirement.
It must not be interpreted as a direct measure of factual accuracy.
A large number of citations does not prove that the citations are correct, relevant or sufficient. Citation quality and factual source fidelity require separate qualitative evaluation.
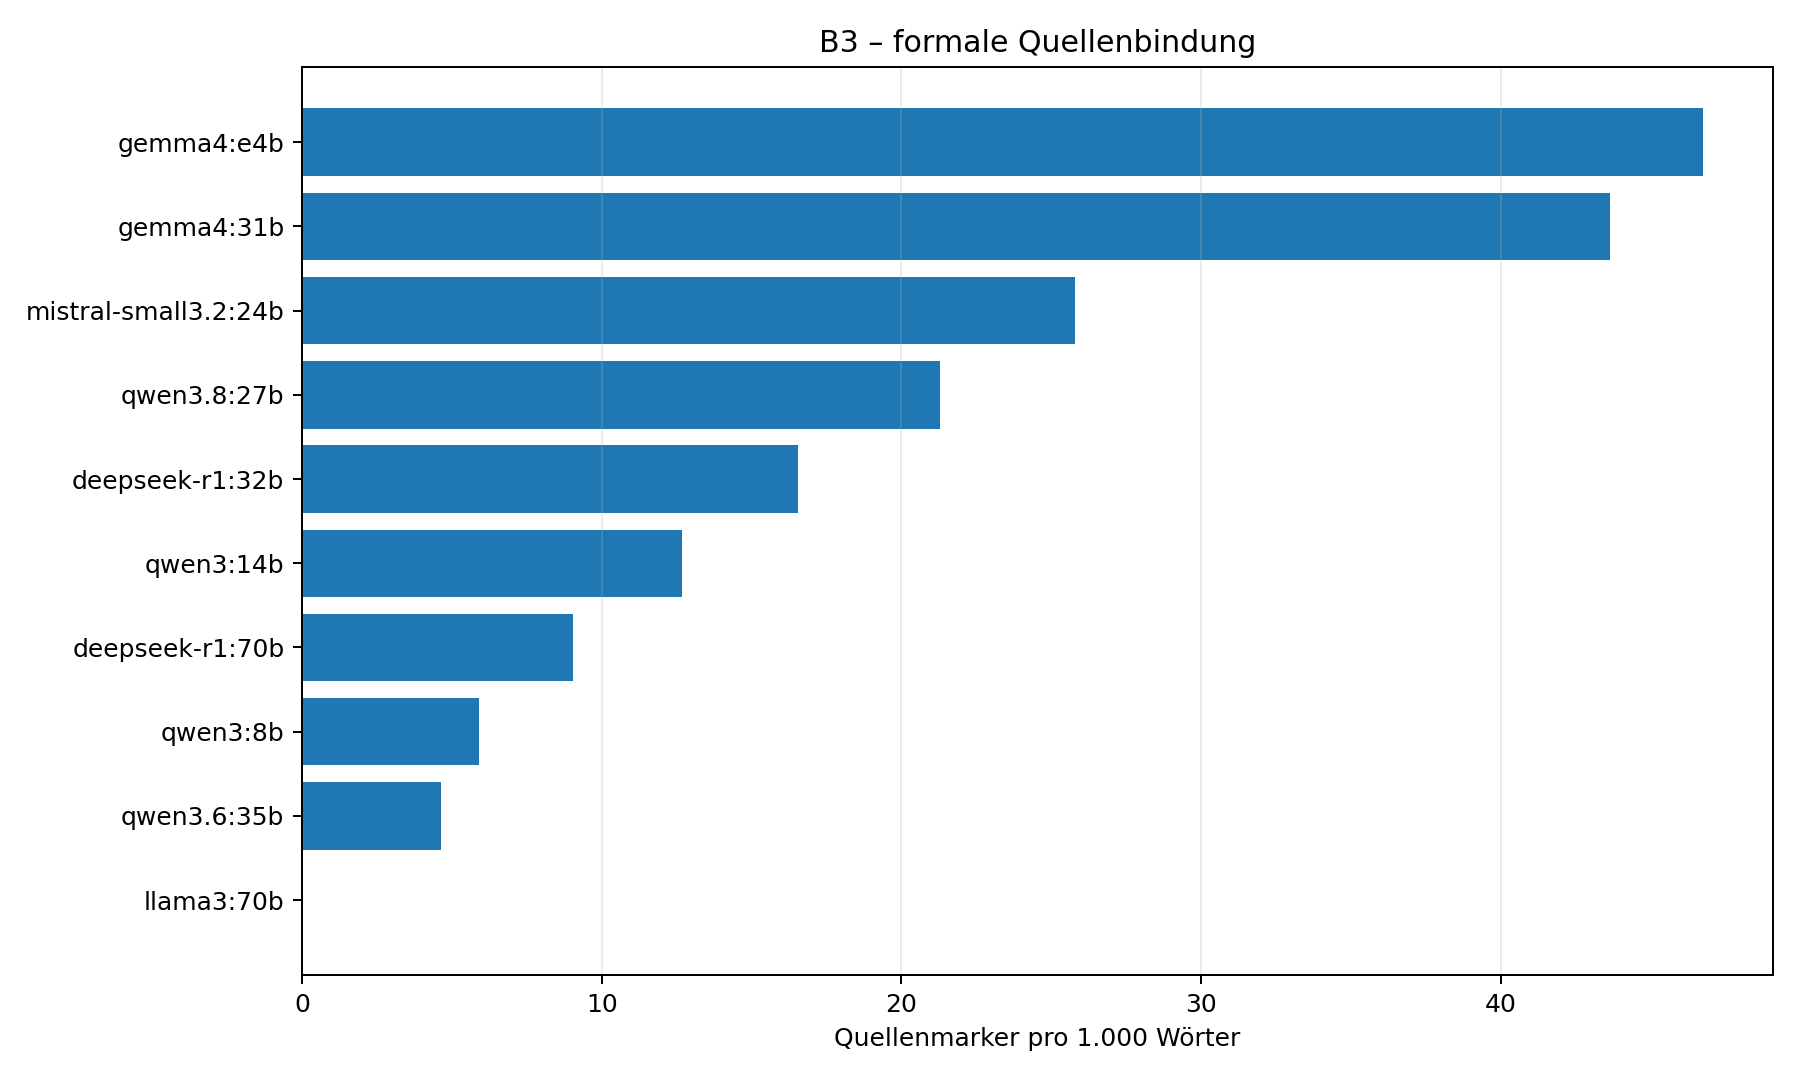
Explicit source-marker density in Benchmark 3. Citation quantity is measured here; citation correctness requires separate qualitative review.
A First Important Observation
Two models illustrate why throughput alone is insufficient.
qwen3.6:35b achieved the highest generation throughput in this test at 8.62 tokens per second while also producing a report close to the requested target length.
gemma4:e4b reached a very similar 8.15 tokens per second, but produced substantially more explicit source references: 76 source markers compared with 8 for qwen3.6:35b.
This does not by itself prove that one model produced the more factually accurate report. Citation quantity is not citation quality, and the source references still require qualitative verification.
It does, however, reveal a significant behavioural difference under identical instructions.
For operational use, this distinction matters. A model optimized for rapid classification or decision support may not be the preferred model for source-grounded research, compliance-sensitive documentation or auditable analytical work.
The relevant engineering question is therefore not: "Which model is best?" but: "Which model is best for this task, on this infrastructure, under these constraints?"
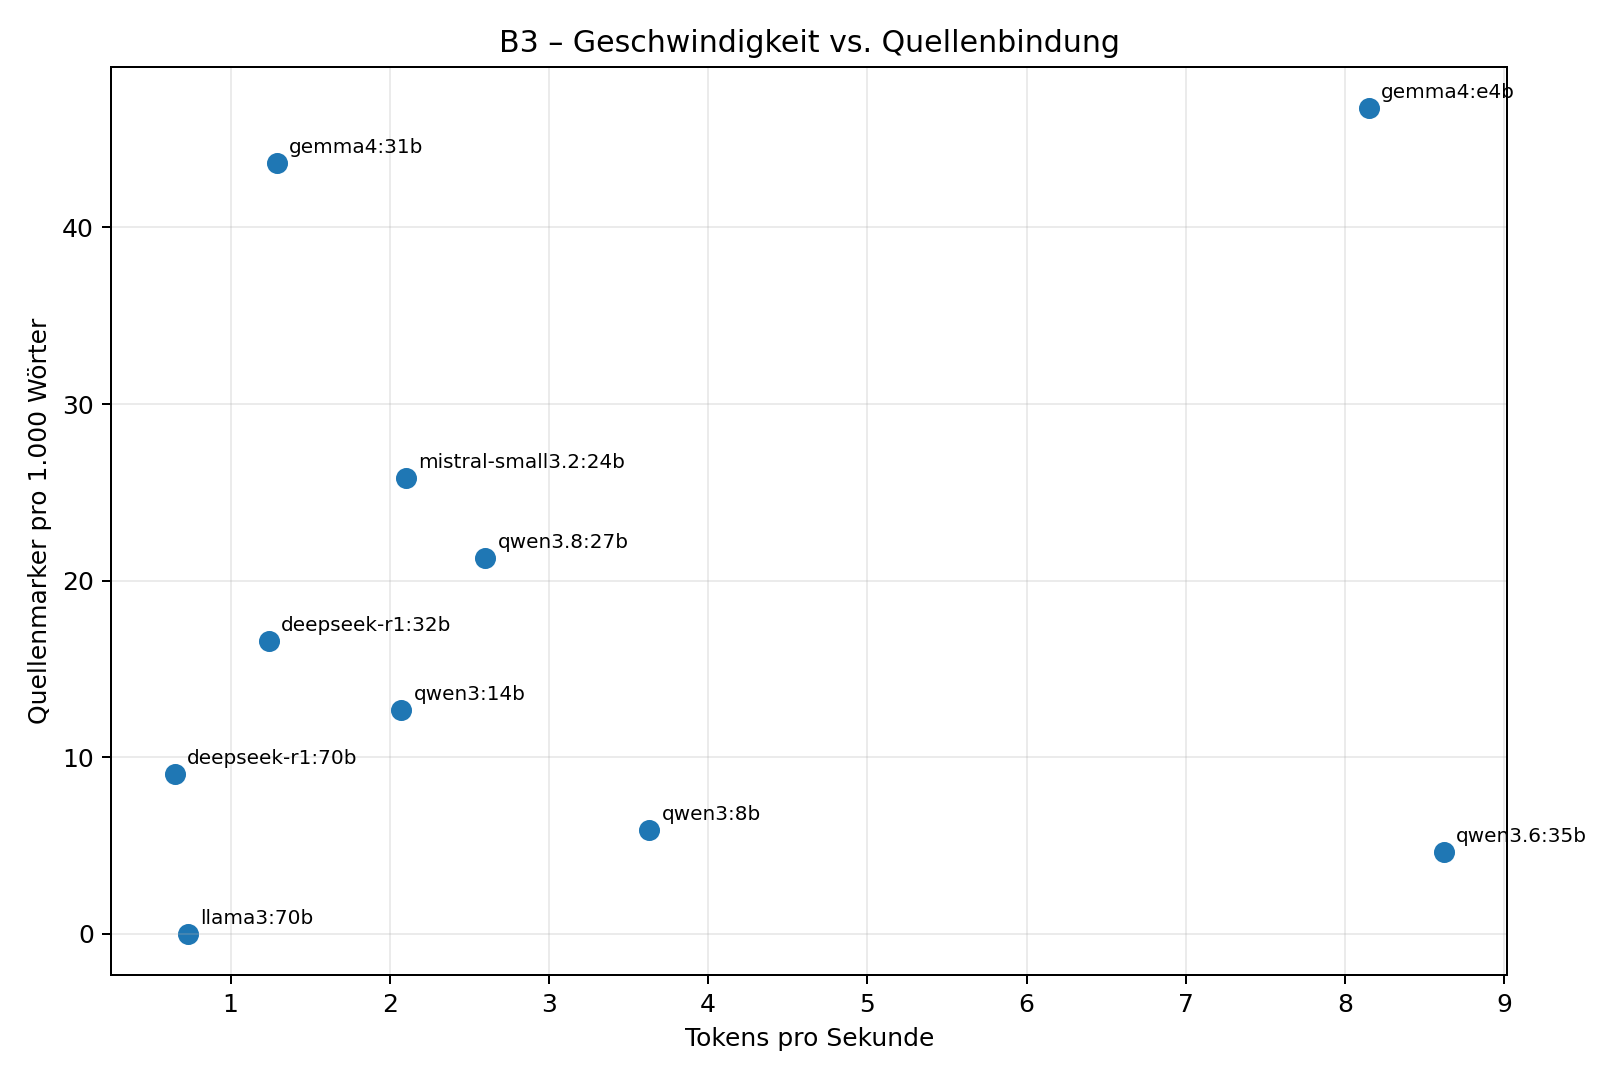
Generation throughput versus explicit source-marker density. The chart illustrates different model behaviour under the same workload; it is not a universal model ranking.
FAST and DEEP: Separating Workload Classes
The next extension was not more hardware but a structural decision about workload. By mid-September the series contained two fundamentally different kinds of tasks: short, latency-critical interactions (context diagnosis, constraint checks, operational decisions) and long, evidence-heavy generation (source-grounded research reports of several thousand words). Forcing both through a single operational path — and averaging them into a single score — would have obscured exactly the behaviour the experiment was designed to measure.
The tracks were therefore separated:
- FAST — deterministic offline model tests with bounded output. FAST-2 is a technical context-diagnosis task; FAST-3 is an architecture/constraint task. FAST-1 is intentionally run separately through the HERMES agent stack, where real agent traffic exercises the same path operationally.
- DEEP — long, evidence-heavy or reasoning-heavy generation under full source-discipline requirements.
The canonical FAST configuration (Scelaris FAST Final, 19 September 2026) ran FAST-2 and FAST-3 with a 32,768-token context and an 8,192-token generation limit. Values are generation throughput (output tok/s); wall time is reported separately where relevant:
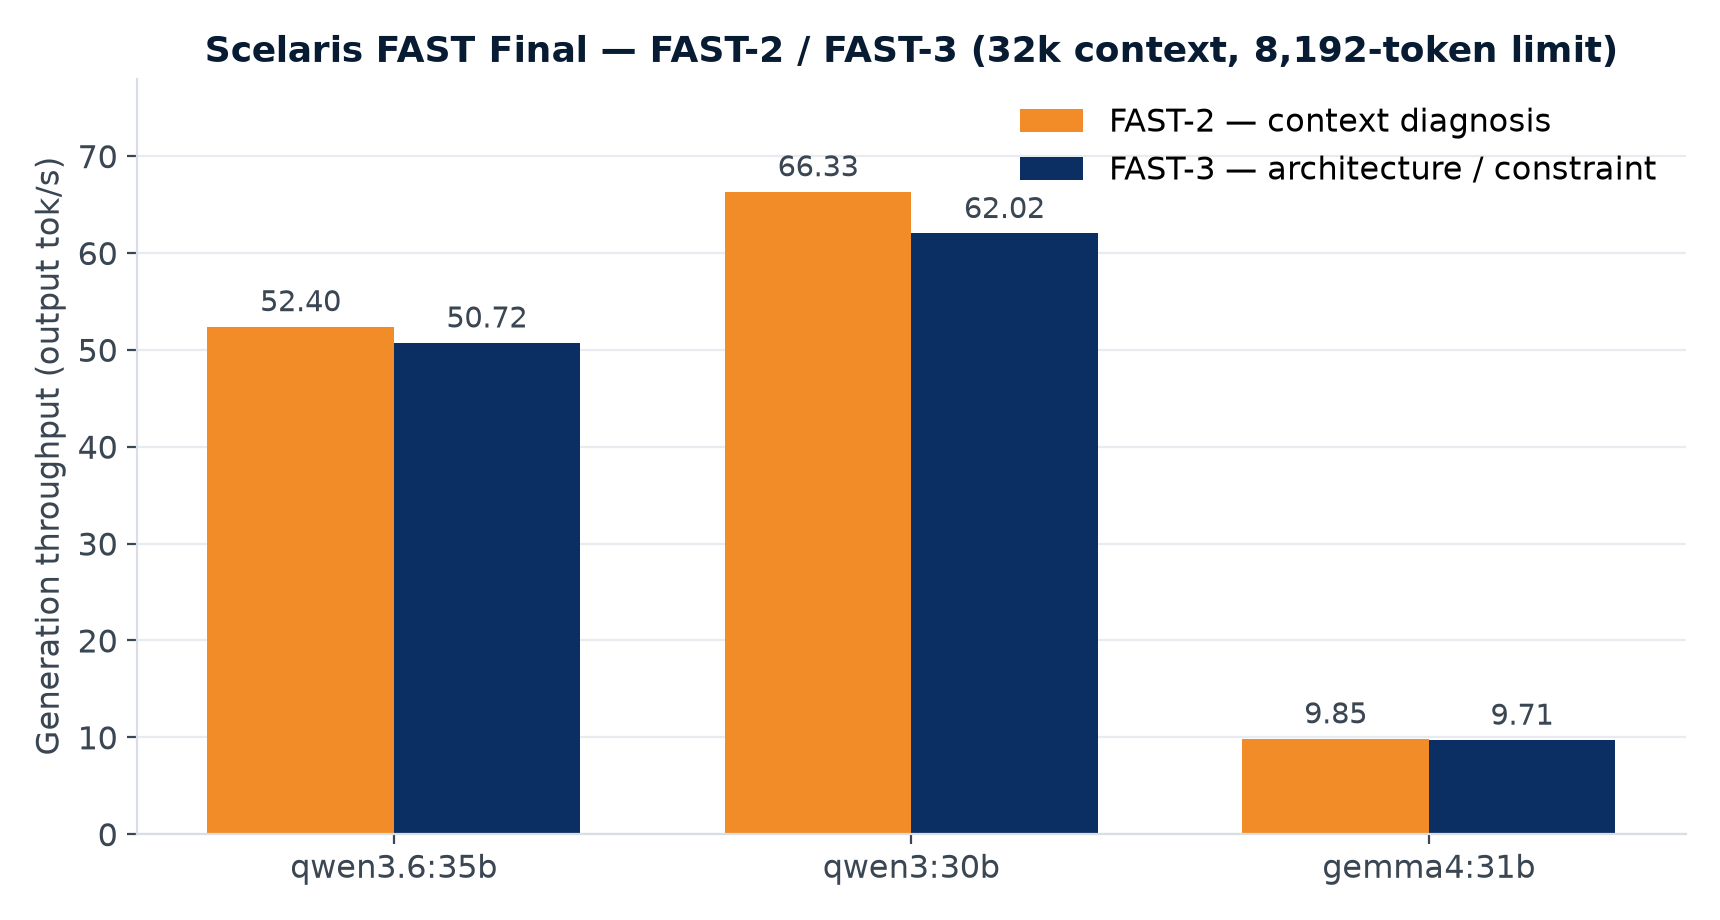
Scelaris FAST Final: generation throughput (output tok/s) per model and task — 32,768-token context, 8,192-token limit, deterministic offline tests.
| Model | FAST-2 | FAST-3 | Completion |
|---|---|---|---|
| qwen3.6:35b | 52.40 tok/s | 50.72 tok/s | stop / stop |
| qwen3:30b | 66.33 tok/s | 62.02 tok/s | stop / stop |
| gemma4:31b | 9.85 tok/s | 9.71 tok/s | stop / stop |
The spread is the point. Models that are broadly comparable by size and intended use — three instruction-tuned models in the 30–35B band — differ by roughly a factor of six in generation throughput on the same tasks, the same platform context and the same configuration. Throughput is one engineering variable, not an overall quality score.
The DEEP track tells the complementary story. The Qwen3.8 Flash Next model, executing the DEEP task under the Ollama runtime, completed DEEP-1 with 3,404 output tokens at a generation throughput of 2.623 output tok/s (total wall time approximately 27 minutes) and DEEP-2 with 2,253 output tokens at 2.695 output tok/s (approximately 20 minutes) — both reaching natural completion (done_reason=stop). (These DEEP-1 and DEEP-2 identifiers refer to the Qwen3.8 Flash Next runs; a separate, larger-model 235B run bearing the same DEEP-1 label exists in the archive and is treated separately in "Where the Limits Appeared".) These are technically sound, complete, source-disciplined runs. At these speeds, however, the same workload/model combination is unsuitable for an interactive path.
This observation is architectural, not evaluative. A model/runtime combination can be genuinely useful for queued, asynchronous analysis while being unusable for interactive assistance. For infrastructure engineering this is a direct argument against single-path designs and against single-number benchmark summaries.
Operational implication: separating latency-sensitive and deep-analysis workloads is a deliberate architecture decision that can be made with measured evidence before production commitments — rather than discovered incidentally in operation.
Runtime as a Fourth Dimension
During the DEEP track, the inference runtime itself became an experimental variable. Later Qwen3.8 Flash Next runs executed on llama.cpp / llama-server instead of the earlier Ollama-based path, using the same DEEP task family:
| Run | Runtime | Output tokens | Generation throughput | Completion |
|---|---|---|---|---|
| DEEP-2 | llama.cpp / llama-server | 16,384 | 3.323 output tok/s | length |
| DEEP-4 | llama.cpp / llama-server | 8,192 | 3.551 output tok/s | length |
| DEEP-6 | llama.cpp / llama-server | 7,867 | 3.454 output tok/s | stop |
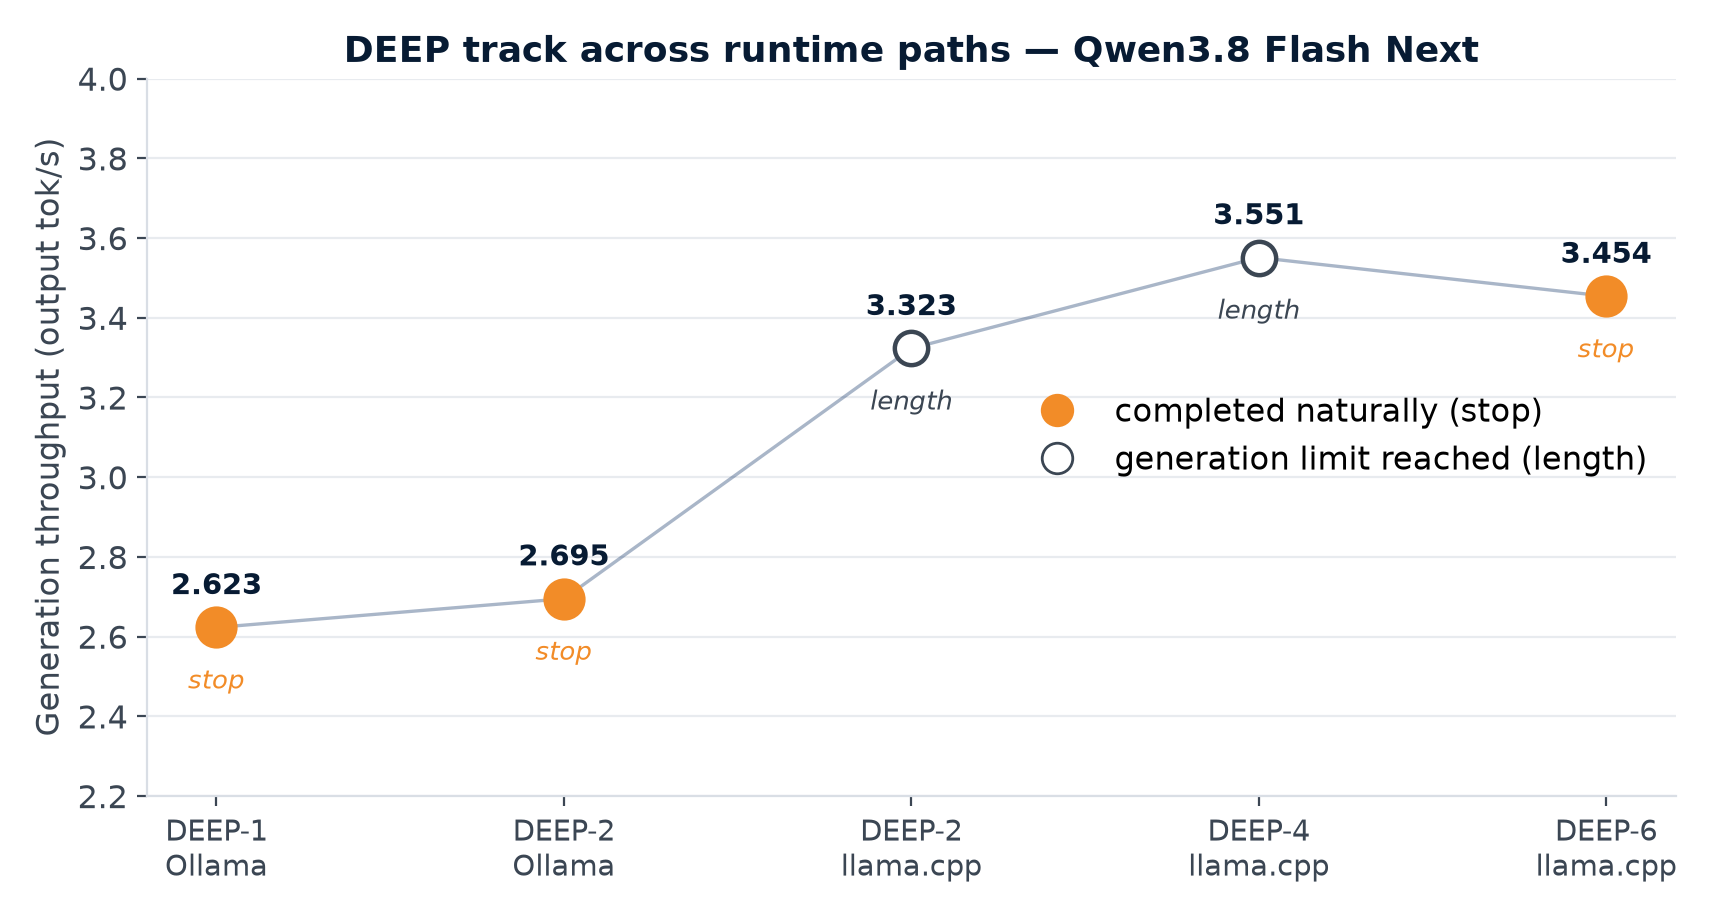
DEEP track across runtime paths for Qwen3.8 Flash Next: generation throughput (output tok/s) per run with completion state. Runs differ in payload and output limits — the chart documents behaviour, not a controlled comparison.
These runs are deliberately not presented as a controlled "llama.cpp is x% faster than Ollama" comparison: the runs differ in task payload and output limits, and the evidence does not establish strict configuration equivalence between the two paths. What the data supports is narrower and, for engineering purposes, more useful:
Runtime itself became an experimentally relevant engineering variable. The same model executing the same task family behaved measurably differently across runtime paths — in throughput, in whether runs completed naturally or reached generation limits, and in operational timing.
This is the empirical justification for extending the principle at the centre of this article from Model × Hardware × Task to Model × Hardware × Runtime × Task.
Operational implication: the runtime is a design parameter. Selecting and configuring it belongs to system engineering, not to application defaults. (The extended Ollama benchmark suite of 21 September 2026 ran on a separate workstation and is deliberately not covered in this article — it addresses different topics and deserves separate treatment.)
Where the Limits Appeared
The benchmark archive deliberately includes runs that reached generation limits, completed too slowly for their intended path, or exposed runtime and context limitations. These are not noise in the dataset. For infrastructure engineering, discovering where a configuration ceases to be operationally useful is itself a result. Three representative examples:
- Generation limits reached. The llama.cpp DEEP-2 and DEEP-4 runs ended with
done_reason=length— the configured generation ceiling, not natural completion. A run that ends at its configured output limit tells you the task wanted more output than the configuration allowed. That is a configuration finding, not a model failure. - Useful but too slow. The Ollama DEEP runs for Qwen3.8 Flash Next produced complete, disciplined output at interactive-unfriendly speeds — documenting the boundary between batch-suitable and interactive-suitable operation for the same model.
- A larger-model operational limit. A qwen3:235b run bearing the DEEP-1 label produced 5,000 output tokens at 1.426 output tok/s and ended at the generation limit (done_reason=length) after approximately 61 minutes total wall time. This documents the practical operational boundary of very large models on this platform for long-generation workloads.
The limits documented here define precisely which boundary the next experiment is designed to probe (see Results).
Model × Hardware × Runtime × Task
The emerging benchmark methodology can therefore be described as a four-dimensional evaluation:
A model is not evaluated independently from the infrastructure running it, the runtime executing it, or the workload it is expected to perform.
The same model may be an excellent choice for one workload and an inefficient or unreliable choice for another. Additional hardware acceleration only creates operational value if it improves the workloads that matter — and, as the DEEP track demonstrated, the runtime layer shifts where the practical limits sit.
The CPU baseline established the first layer of this matrix. The GPU stage expanded the measurable model space, the FAST/DEEP separation made the workload dimension explicit, and the runtime investigation added the fourth axis. What began as a test plan is now a populated evaluation space with documented boundaries.
Results
Phase 1 — CPU Baseline: Completed
The CPU-only benchmark series has established the initial performance and behavioural baseline for the tested local models. The first results already demonstrate that model size and raw throughput cannot be considered independently from workload requirements. Significant differences were observed in generation speed, constraint compliance, source-grounding behaviour and practical task completion.
The results shown here are intentionally treated as engineering measurements rather than universal model rankings.
Phase 2 — GPU Acceleration: Executed
Adding GPU capability expanded the experiment and enabled the broader model spectrum and the later workload tracks. Individual run configurations — offload state, VRAM distribution — are documented in the measurement archive rather than asserted per result.
FAST and DEEP: Separated and measured
The canonical FAST final dataset and the DEEP track measurements are published in the sections above.
Runtime: Established as a fourth dimension
The llama.cpp/llama-server DEEP runs are documented above, and runtime behaviour is confirmed as an experimentally relevant variable.
Next experiment — Strata (planned)
The next experiment will test whether a runtime optimized specifically for Qwen3.8 Flash Next changes the operational boundary measured so far. No results exist yet; it is documented as the planned next step, nothing more.
Closing
The goal of this evaluation is not to identify a universally "best" model or hardware platform. It is to determine which combination of model, hardware, runtime and workload provides the appropriate balance of performance, quality, operational complexity and cost for a given workload.
The methodology now continues where the measured boundary sits: the next planned experiment targets the runtime layer directly.